import numpy as np
import pandas as pd
import matplotlib.pyplot as pltCorrection of 2nd exam 2024/25
NES—Programmiertechniken (Introduction to scientific programming)
21.03.2025
Please work through the following tasks. You have 75 minutes to complete the exam.
Make sure you executed all relevant code cells and save the notebook before the end of the exam.
This is a correction of the exam questions. Like always in programming, there are many ways to achieve similar results. My suggestions here follow our coding exercises discussed in class.
If you want to solve this exam as an exercise, download the uncorrected notebook.
Question 1: Multiple-choice (5 points)
To tick correct answers, replace - [ ] with - [x]
Careful: Wrongly ticked answers will give negative points!
(a) Loops and vectorization
Which of the following statements are true? (2.5 points)
(b) Indexing
Which of the statements about the following code block are true? (2.5 points)
a = np.arange(12).reshape((3, 4))
b = a * 2
nz = np.nonzero(a > 8)
b[nz] = a[nz]Question 2: Spreadsheet data
- Read the dataset global_energy.csv into a DataFrame called
df. (1 point)
df = pd.read_csv('global_energy.csv')
df| Country | Year | Renewable Energy Share (%) | Fossil Fuel Dependency (%) | Industrial Energy Use (%) | |
|---|---|---|---|---|---|
| 0 | Canada | 2018 | 50.38 | 49.540 | 43.39 |
| 1 | Germany | 2018 | 53.14 | 42.270 | 43.11 |
| 2 | Russia | 2018 | 48.71 | 43.800 | 33.10 |
| 3 | Brazil | 2018 | 52.16 | 45.240 | 36.70 |
| 4 | UK | 2018 | 45.28 | 41.320 | 38.89 |
| ... | ... | ... | ... | ... | ... |
| 245 | India | 2000 | 42.31 | 48.380 | 39.11 |
| 246 | Australia | 2000 | 56.51 | 45.100 | 35.06 |
| 247 | China | 2000 | 45.87 | 44.365 | 36.89 |
| 248 | USA | 2000 | 47.52 | 48.900 | 38.89 |
| 249 | Japan | 2000 | 36.53 | 48.360 | 42.95 |
250 rows × 5 columns
- How many unique countries does the data set contain? (1 point)
countries = df['Country'].unique().shape[0]- What are the oldest and most recent years recorded in the DataFrame? (1 point)
df['Year'].min(), df['Year'].max()(np.int64(2000), np.int64(2024))- How many rows does the DataFrame contain with ‘Renewable Energy Share (%)’ more than 50 % and at the same time ‘Fossil Fuel Dependency (%)’ lower than 50 %? (2 points)
np.sum((df['Renewable Energy Share (%)'] > 50) & (df['Fossil Fuel Dependency (%)'] < 50))np.int64(65)Create a subset
df_subof the DataFramedfthat contains only records from Canada and USA, and only the following columns:
‘Year’, ‘Renewable Energy Share (%)’, ‘Fossil Fuel Dependency (%)’Make sure you do this in a way that avoids any potential side effects.
(2 points)
df_sub = df.loc[df['Country'].isin(['Canada', 'USA']), ['Year', 'Renewable Energy Share (%)', 'Fossil Fuel Dependency (%)']].copy()Using
df_suband thegroupbymethod, create a quick working plot like the following: (2 points)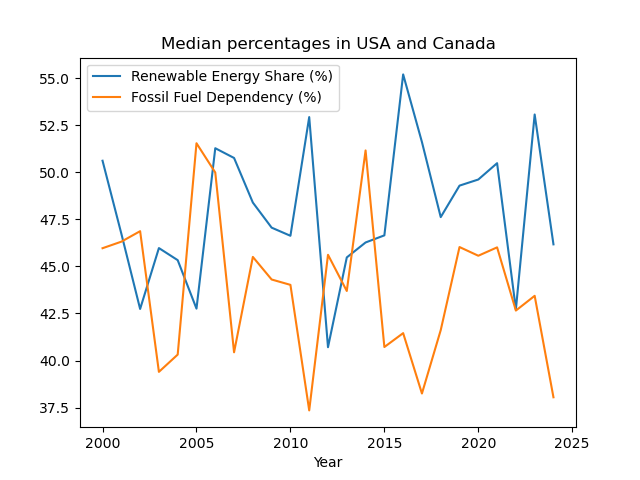
df_annual = df_sub.groupby('Year').median()
df_annual.plot(title='Median percentages in USA and Canada')
plt.show()
- The following code cell computes a Pandas Series
range_renewables. Compute a Numpy arrayrange_renewables_loopthat contains the same values asrange_renewablesbut use afor-loop for the computation instead of thegroupbymethod. (2 points)
df_min = df.groupby('Country').min()
df_max = df.groupby('Country').max()
range_renewables = df_max['Renewable Energy Share (%)'] - df_min['Renewable Energy Share (%)']
range_renewables_loop = []
for country in df['Country'].unique():
renewables = df.loc[df['Country'].isin([country]), 'Renewable Energy Share (%)']
range_renewables_loop.append(renewables.max() - renewables.min())
range_renewables_loop = np.array(range_renewables_loop)- Do the equivalent computation of the following code cell using
dfandrange_renewables_loopto display the country. (1 point)
Tip: If you cannot remember the equivalent Numpy method, briefly skim the documentation ofidxmaxfor help.
range_renewables.idxmax()'Germany'df['Country'].unique()[range_renewables_loop.argmax()]'Germany'Question 3: datetime calculations
- Create a DataFrame
dfwith a DatetimeIndex ranging from2025-01-01 00:00to2025-12-31 23:00in hourly sampling. (1 point)
df = pd.DataFrame(index=pd.date_range('2025-01-01 00:00', '2025-12-31 23:00', freq='h'))- Create a column named
hour_of_yearthat stores the hour count from 1 to the total number of hours in 2025. (1 point)
df["hour_of_year"] = np.arange(1, df.shape[0] + 1)- Create another column
sin_wavethat computes the sine ofhour_of_year, using the formula: (1 point)
\[ \sin\left(\frac{2\pi \cdot \text{hour\_of\_year}}{8760}\right) \]
df["sin_wave"] = np.sin((2 * np.pi * df["hour_of_year"]) / 8760)- Find the first datetime where
sin_waveis close to 0 (using the functionnp.isclose). (1 point)
df.index[np.isclose(df['sin_wave'], 0)][0]Timestamp('2025-07-02 11:00:00')Resample
sin_waveto daily minimum, mean, and maximum values and plot the results of the month of September. Reproduce the following figure as closely as possible.
Tip: Use the Axes methodfill_betweenfor the shaded area artist.(7 points)
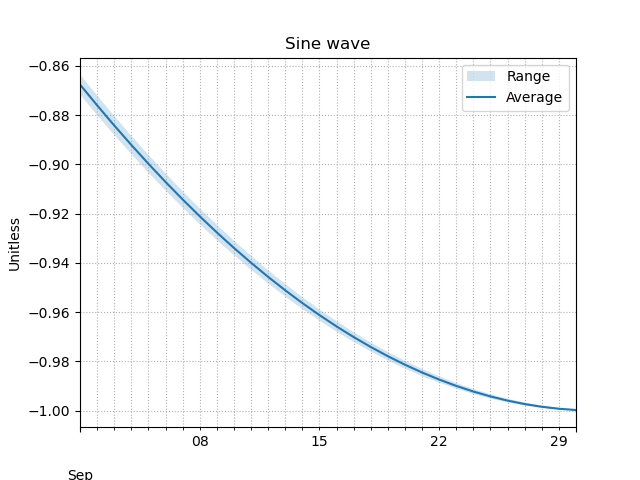
dfr = pd.DataFrame()
dfr['max'] = df['sin_wave'].resample('D').max()
dfr['min'] = df['sin_wave'].resample('D').min()
dfr['mean'] = df['sin_wave'].resample('D').mean()
dfr = dfr.loc[dfr.index.month==9]

fig, ax = plt.subplots()
ax.fill_between(dfr.index, dfr['min'], dfr['max'], alpha=0.2, label="Range")
dfr['mean'].plot(label="Average")
ax.set_title("Sine wave")
ax.set_ylabel("Unitless")
ax.legend()
ax.grid(linestyle=':', which='both')
plt.show()
Question 4: Functions and Classification
Define a function
determine_phase_of_waterthat determines whether water is frozen or liquid at the given temperature. The function should take one positional argumenttempand one keyword argumentunit, which defaults to"Celsius". (6 points)- If
unitis not one of"Celsius"or"Farenheit", raise a ValueError with a meaningful error message.
(If you don’t know how to raise a ValueError print a meaningful error message and returnNone.) - If
tempis below 0°C or 32°F, return"solid". - Otherwise, return
"liquid".
- If
Write the docstring for the function, also including the Parameters and Returns sections. (2 points)
def determine_phase_of_water(temp, unit="Celsius"):
    """Determine the phase state of water at a given temperature

    Parameters
    ----------
    temp: float
        Temperature of water

    unit: str
        Unit of given temperature

    Returns
    -------
    str
        Phase state
    """

    if unit not in ["Celsius", "Farenheit"]:
        raise ValueError("Unknown unit.")

    if unit == "Celsius" and temp < 0:
        return "solid"
    elif unit == "Farenheit" and temp < 32:
        return "solid"
    else:
        return "liquid"
## You can use this code block to check the results of your function.
# No need to change anything here.
print(determine_phase_of_water(-5))
print(determine_phase_of_water(70))
print(determine_phase_of_water(20, "Farenheit"))
try:
print(determine_phase_of_water(273, "Kelvin"))
except ValueError as e:
print(e)solid
liquid
solid
Unknown unit.