import numpy as np
import pandas as pd
import matplotlib.pyplot as pltCorrection of 1st exam 2023/24
NES—Programmiertechniken (Introduction to scientific programming)
19.01.2023
Please work through the following tasks. You have 75 minutes to complete the exam.
Make sure you executed all relevant code cells and save the notebook before the end of the exam.
This is a correction of the exam questions. Like always in programming, there are many ways to achieve similar results. My suggestions here follow our coding exercises discussed in class.
If you want to solve this exam as an exercise, download the uncorrected notebook.
Question 1: Multiple-choice (5 points)
Careful: wrongly ticked answers will give negative points!
- Which of the following statements are true? (2 points)
- Which of the following statements are true about this line of code: (2 points)
conda create -n scipro2023 python=3.11 ipython jupyterlab numpy pandas scipy matplotlib
Question 2: datetime calculations (5 points)
Your working directory contains a python module named solar_exam. You know most of the module already from our lecture assignments. I just added one more function to it.
Solve the following tasks:
- Create a DataFrame
dfwith a DatetimeIndex ranging from2024-01-01 00:00to2024-01-31 23:00in hourly sampling. (1 point)
datetime = pd.date_range('2024-01-01 00:00', '2024-01-31 23:00', freq='H')
df = pd.DataFrame(index=datetime)- Use
dfand the functioncompute_solar_dataframe()contained insolar_examto fill your data frame with data columns. (1 point)
import solar_exam as solar
df = solar.compute_solar_dataframe(df)
print(df)
hourangle declination elevangle azimuth radiation
2024-01-01 00:00:00 -180.0 -22.930544 -65.518144 NaN 0.0
2024-01-01 01:00:00 -165.0 -22.930544 -62.729858 211.348308 0.0
2024-01-01 02:00:00 -150.0 -22.930544 -55.750441 234.906273 0.0
2024-01-01 03:00:00 -135.0 -22.930544 -46.681349 251.665818 0.0
2024-01-01 04:00:00 -120.0 -22.930544 -36.760543 264.601524 0.0
... ... ... ... ... ...
2024-01-31 19:00:00 105.0 -17.516495 -22.868690 88.634290 0.0
2024-01-31 20:00:00 120.0 -17.516495 -32.974356 100.117762 0.0
2024-01-31 21:00:00 135.0 -17.516495 -42.681114 113.470138 0.0
2024-01-31 22:00:00 150.0 -17.516495 -51.303953 130.299509 0.0
2024-01-31 23:00:00 165.0 -17.516495 -57.665833 152.518291 0.0
[744 rows x 5 columns]/home/flo/miniconda3/envs/scipro2023/lib/python3.11/site-packages/pandas/core/arraylike.py:396: RuntimeWarning: invalid value encountered in arccos
result = getattr(ufunc, method)(*inputs, **kwargs)- The resulting DataFrame likely contains some NaN. Which columns contain how many NaN’s? (1 point)
df.isna().sum()hourangle 0
declination 0
elevangle 0
azimuth 29
radiation 0
dtype: int64- Resample the two columns
declinationandelevangleto daily sampling by computing each day’s average values.
Create a quick working plot of these average values with as few lines of code as possible. The resulting figure looks like that: (2 points)
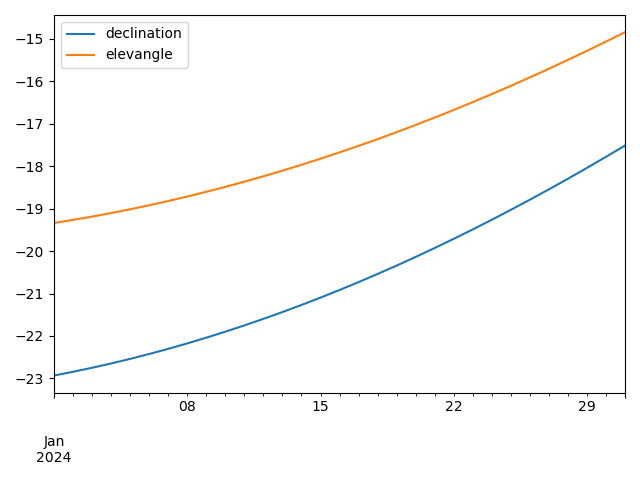
dfr = df[['declination', 'elevangle']].resample('D').mean()
dfr.plot()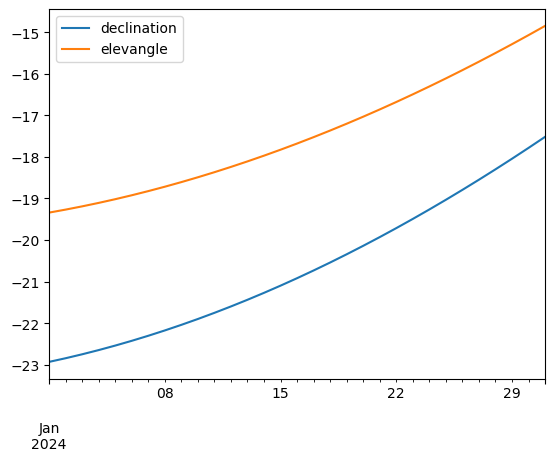
Question 3: Spreadsheet data (8.5 points)
Your working directory contains a spreadsheet data set about the hydropower consumption of different countries over several decades.
Solve the following tasks:
- Load the data contained in the spreadsheet
dataset.csv. (1 point)
hc = pd.read_csv('dataset.csv')
print(hc)
Country Code Year Electricity
0 Afghanistan AFG 2000 0.31
1 Afghanistan AFG 2001 0.50
2 Afghanistan AFG 2002 0.56
3 Afghanistan AFG 2003 0.63
4 Afghanistan AFG 2004 0.56
... ... ... ... ...
7569 Zimbabwe ZWE 2016 2.95
7570 Zimbabwe ZWE 2017 3.93
7571 Zimbabwe ZWE 2018 5.00
7572 Zimbabwe ZWE 2019 7.26
7573 Zimbabwe ZWE 2020 7.26
[7574 rows x 4 columns]- How many unique countries does the data set contain? (1 point)
hc['Country'].unique().shape[0]224- How many records are contained in the data set where the electricity is greater or equal to 100 but below 250 TWh? (1 point)
np.sum((hc['Electricity'] >= 100) & (hc['Electricity'] < 250))215- Sort the countries according to most hydropower consumed. Use the DataFrame methods
.groupby()and.sort_values()for this task. (1.5 points)
hcm = hc.groupby(['Country']).max()
hcm.sort_values('Electricity', ascending=False)| Code | Year | Electricity | |
|---|---|---|---|
| Country | |||
| Asia | NaN | 2020 | 1958.06 |
| China | CHN | 2021 | 1322.01 |
| Europe | NaN | 2021 | 775.34 |
| Latin America and Caribbean | NaN | 2021 | 765.88 |
| North America | NaN | 2021 | 746.22 |
| ... | ... | ... | ... |
| Solomon Islands | SLB | 2020 | 0.00 |
| Cyprus | CYP | 2021 | 0.00 |
| South Sudan | SSD | 2020 | 0.00 |
| Cook Islands | COK | 2020 | 0.00 |
| Saint Lucia | LCA | 2020 | 0.00 |
224 rows × 3 columns
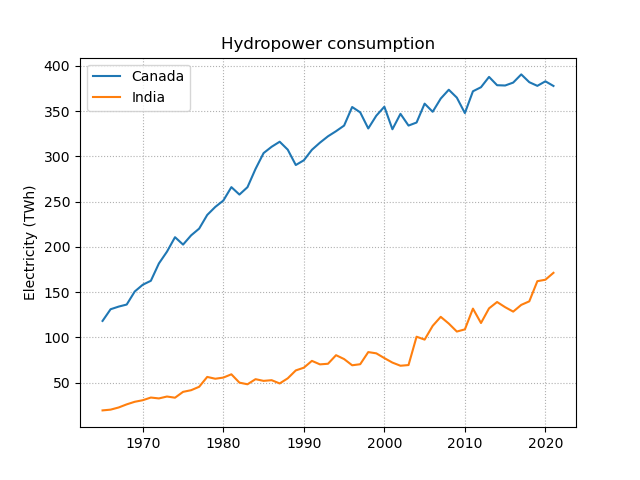
- Plot the electricity curves of the two countries with most hydropower consumption. Make your figure look as similar as possible to the following one.
If you don’t know which countries did consume most hydropower, use Canada and India. (2 points)
country1 = 'Asia'
country2 = 'China'

fig, ax = plt.subplots()
ax.plot(hc.loc[hc['Country'] == country1, 'Year'], hc.loc[hc['Country'] == country1, 'Electricity'], label=country1)
ax.plot(hc.loc[hc['Country'] == country2, 'Year'], hc.loc[hc['Country'] == country2, 'Electricity'], label=country2)
ax.legend()
ax.grid(linestyle='dotted')
ax.set_ylabel('Electricity (TWh)')
ax.set_title('Hydropower consumption')
plt.show()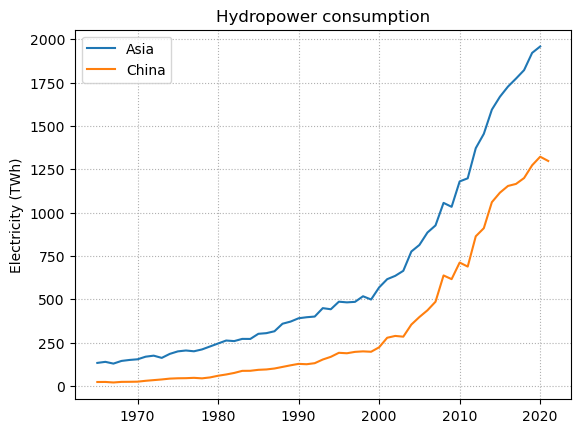
- Not all countries are associated with a country code. Iterate through all unique countries to find out which countries are not associated with a code. Your loop should
- print a list of countries whose country code is NaN and
- count and display how many countries those are.
The DataFrame method .isin() and the numpy NaN np.nan will be helpful.
(2 points)
counter = 0
for country in hc['Country'].unique():
    if hc.loc[hc['Country'] == country, 'Code'].isin([np.nan]).any():
        print(country)
        counter = counter + 1

print(counter)
Africa
Asia
Eastern Africa
Europe
European Union (27)
Latin America and Caribbean
Low-income countries
Lower-middle-income countries
Middle Africa
Middle East
North America
Oceania
South America
Western Africa
14Question 4: Functions (5 points)
The following code cell contains a function signature with its documentation. Code the according function body.
Tip: You can use the numpy function np.floor() to help you separate the floating point number into its whole number and the decimal number. Consult the interactive documentation of np.floor() if you need more explanation or want to look at examples.
def pretty_print_hours(hours):
    """Convert a floating point representation of hours into a more human readable string format of 'hours:minutes'.
    The function does not allow negative inputs!

    Parameters
    ----------
    hours: float
        Hours to convert (No negative numbers allowed!)

    Returns
    -------
    out: string
        Hours in the format 'hours:minutes'

    Examples
    --------
    >>> pretty_print_hours(1.5)
    '1:30'
    >>> pretty_print_hours(-2.3)
    Traceback (most recent call last):
     ...
    ValueError: 'hours' cannot be negative!
    """
    if hours < 0:
        raise ValueError("'hours' cannot be negative!")

    hours_int = int(np.floor(hours))
    min_decimal = hours - hours_int
    min_int = int(min_decimal * 60)

    out = f'{hours_int}:{min_int}'

return outpretty_print_hours(1.5)'1:30'pretty_print_hours(-2.3)--------------------------------------------------------------------------- ValueError Traceback (most recent call last) Cell In[14], line 1 ----> 1 pretty_print_hours(-2.3) Cell In[12], line 25, in pretty_print_hours(hours) 2 """Convert a floating point representation of hours into a more human readable string format of 'hours:minutes'. 3 The function does not allow negative inputs! 4 (...) 22 ValueError: 'hours' cannot be negative! 23 """ 24 if hours < 0: ---> 25 raise ValueError("'hours' cannot be negative!") 27 hours_int = int(np.floor(hours)) 28 min_decimal = hours - hours_int ValueError: 'hours' cannot be negative!
Question 5: Debugging (3 points)
Let’s first define three variables:
count = np.arange(10, 20)
v1 = np.full(count.shape, False)
v2 = np.full(count.shape, False)
Now, read through the next code block that uses logical indexing to change some values of v1:
v1[(count > 13) & (count < 17)] = TrueThe following code block tries to re-write the logical indexing into a loop.
Unfortunately, there are three mistakes in the next code block.
Fix the mistakes, so that v1 and v2 are equal.
# Code cell with mistakes:
for ct in enumerate(count):
    if ct > 13 and ct < 17:
    v2[ct] = True
# Corrected code cell:
for i, ct in enumerate(count):
if ct > 13 and ct < 17:
v2[i] = TrueTest whether v1 and v2 are equal:
np.array_equal(v1, v2)True# Corrected code cell (alternative strategy applied by several students):
for ct in range(len(count)):
if count[ct] > 13 and count[ct] < 17:
v2[ct] = True