import numpy as np
import pandas as pd
import matplotlib.pyplot as pltCorrection of 1st exam 2024/25
NES—Programmiertechniken (Introduction to scientific programming)
31.01.2025
Please work through the following tasks. You have 75 minutes to complete the exam.
Make sure you executed all relevant code cells and save the notebook before the end of the exam.
This is a correction of the exam questions. Like always in programming, there are many ways to achieve similar results. My suggestions here follow our coding exercises discussed in class.
If you want to solve this exam as an exercise, download the uncorrected notebook.
Question 1: Theory (5 points)
(a) Multiple-choice
To tick correct answers, replace - [ ] with - [x]
Careful: Wrongly ticked answers will give negative points!
Which of the following statements are true? (2.5 points)
(b) Rapid-response
- Example: What programming language did our course focus on?
- Answer: Python
Careful: Wrong answers will give negative points. No answers will yield 0 points (i.e., no negative and no positive points)
Answer the following prompts with one word only! (2.5 points)
- Name one package and environment manager for Python!
- Answer: conda
- What file ending do common Python scripts have?
- Answer: .py
- Which keyword is used to skip the current iteration in a loop?
- Answer: continue
- Name one immutable data type in Python!
- Answer: tuple, string
- What is the data structure called that provides a name for each row in a Pandas DataFrame?
- Answer: Index
Question 2: A wind turbine on top of Piz Buin
Imagine you had to place a wind turbine on top of Piz Buin, Vorarlberg’s highest mountain. A turbine that always faces the same direction and can’t turn into the wind. In which direction should it look? You will work with wind data from Piz Buin for all of 2024 to make a decision.
Part I: Initial data exploration (6 points)
- Read the dataset wind_PizBuin.csv into a DataFrame called
dfand create a DatetimeIndex with the columndatetime. (2 points)
df = pd.read_csv("wind_PizBuin.csv", parse_dates=True, index_col='datetime')
df| wind_speed | wind_direction | |
|---|---|---|
| datetime | ||
| 2024-01-01 00:00:00 | 4.1 | 15 |
| 2024-01-01 01:00:00 | 4.4 | 351 |
| 2024-01-01 02:00:00 | 5.4 | 360 |
| 2024-01-01 03:00:00 | 3.2 | 360 |
| 2024-01-01 04:00:00 | 3.8 | 17 |
| ... | ... | ... |
| 2024-12-31 19:00:00 | 1.5 | 300 |
| 2024-12-31 20:00:00 | 1.4 | 293 |
| 2024-12-31 21:00:00 | 1.5 | 263 |
| 2024-12-31 22:00:00 | 1.8 | 233 |
| 2024-12-31 23:00:00 | 2.0 | 225 |
8784 rows × 2 columns
- Create a histogram of the column
'wind_direction'. (0.5 points)
df['wind_direction'].hist()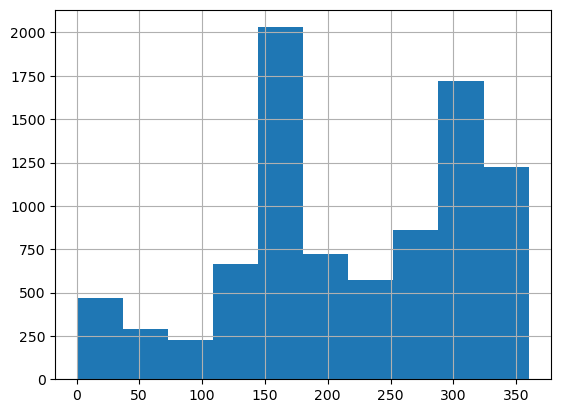
- Add a column to
dfnamedwind_sector, which should be'S'(for South) when 270 > wind_direction >= 90, and'N'(for North) otherwise. Do not use a loop to solve this task. (2 points)
df['wind_sector'] = 'N'
df.loc[(df['wind_direction'] >= 90) & (df['wind_direction'] < 270), 'wind_sector'] = 'S'
df| wind_speed | wind_direction | wind_sector | |
|---|---|---|---|
| datetime | |||
| 2024-01-01 00:00:00 | 4.1 | 15 | N |
| 2024-01-01 01:00:00 | 4.4 | 351 | N |
| 2024-01-01 02:00:00 | 5.4 | 360 | N |
| 2024-01-01 03:00:00 | 3.2 | 360 | N |
| 2024-01-01 04:00:00 | 3.8 | 17 | N |
| ... | ... | ... | ... |
| 2024-12-31 19:00:00 | 1.5 | 300 | N |
| 2024-12-31 20:00:00 | 1.4 | 293 | N |
| 2024-12-31 21:00:00 | 1.5 | 263 | S |
| 2024-12-31 22:00:00 | 1.8 | 233 | S |
| 2024-12-31 23:00:00 | 2.0 | 225 | S |
8784 rows × 3 columns
- Using the
.groupby()method, compute the medianwind_speedand medianwind_directionfor each of the twowind_sectors. (1.5 points)
df.groupby('wind_sector').median()| wind_speed | wind_direction | |
|---|---|---|
| wind_sector | ||
| N | 4.8 | 305.0 |
| S | 5.4 | 166.0 |
From the histogram we see that the wind generally blows from two directions. It tends to be slightly stronger for the southerly wind, but we still can’t make a decision. What if the turbine is best placed in between these two directions? We need more detailed analyses..
Part II: Grid search (9 points)
Using a grid search, identify in which direction the wind turbine should ideally look to produce most energy. To do so, perform the following tasks:
- Import the wind_module. (0.5 points)
import wind_module- Define a function named
power2energythat computes energy from an array of wind power and the time samplingdt. (2.5 points)- Set the default value for
dtto 1 (which aligns with our hourly dataset). - Reminder: \(E = \sum P \cdot \Delta t\), where \(E\) is energy, \(P\) is power, and \(\Delta t\) is
dt.
- Set the default value for
def power2energy(power, dt=1):
    energy = np.sum(power) * dt
return energy- Define a numpy array
turbine_directionswith angles from 0 to 355 in steps of 5 degrees,
and initialize an arrayenergiesof the same shape withnp.nan. (1 point)
turbine_directions = np.arange(0, 360, 5)
energies = np.full(turbine_directions.shape, np.nan)- Iterate over the array
turbine_directionsand- compute the time series of power produced by the wind turbine using the function
compute_wind_power()in thewind_module. You will have to provide wind speed and direction from the DataFramedf(Part I), and the turbine direction. - convert the time series of power to energy and store it at the relevant location within
energies.
- compute the time series of power produced by the wind turbine using the function
for i, direction in enumerate(turbine_directions):
    power = wind_module.compute_wind_power(df['wind_speed'], df['wind_direction'], direction)
    energy = power2energy(power)
energies[i] = energy- Normalize the array
energieswith its maximum value and store the result in a new array namedenergies_normalized. (1 point)
energies_normalized = energies/np.max(energies)- Which turbine direction produced most energy? (1 point)
Write a short code snippet to find the answer. Here is a visualization to verify whether your result makes sense:
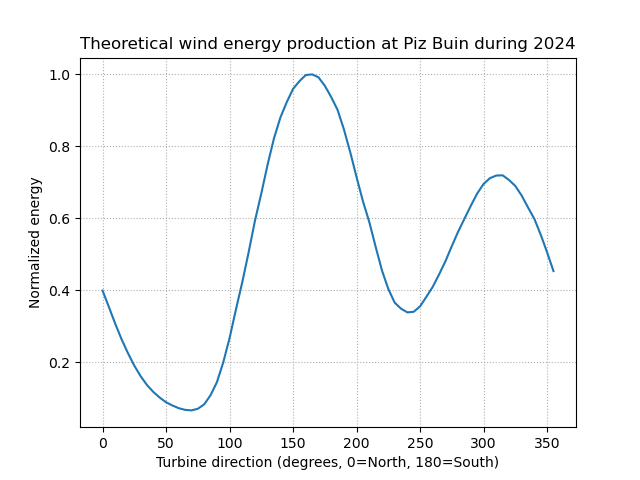
turbine_directions[np.argmax(energies_normalized)]np.int64(165)Part III: Working with and plotting timeseries (12 points)
- How many unique
day_of_weekdoes the DatetimeIndex of the DataFramedfcontain? Write a code snippet to find the answer! (1.5 points)
unique_days_of_week = df.index.day_of_week.unique()
unique_days_of_week.shape[0]7- Subset the DataFrame
dfto the period of 29th of January 2024 – 4th of February 2024 and name the resulting DataFramedfs.
Make sure you do this in a way that avoids any potential side effects (orSettingWithCopyWarnings later in the code)! (1.5 points)
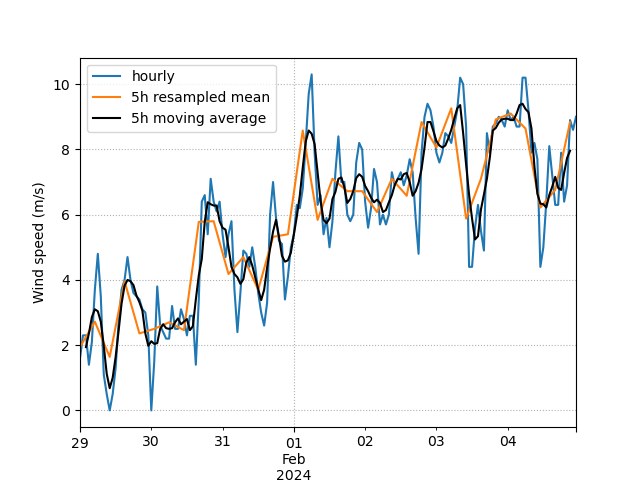
dfs = df["2024-01-29":"2024-02-04"].copy()- Using
dfs, create a plot as closely as possible to the following one:- one curve represents the wind speed as provided in the DataFrame
- one curve shows the 5 hour resampled mean wind speed (Tip: Use the frequency
'5h'to achieve this!) - one curve displays a moving average with a 5 hour window. Implement the moving average with a for-loop that fills a new column named
dfs['wind_ma_5h']!
dfs['wind_ma_5h'] = np.nan
for i in range(2, dfs.shape[0]-2):
    dfs.loc[dfs.index[i], 'wind_ma_5h'] = dfs.loc[dfs.index[i-2]:dfs.index[i+2], 'wind_speed'].mean()

dfs_5h_mean = dfs['wind_speed'].resample('5h').mean()
f, ax = plt.subplots()
dfs['wind_speed'].plot(ax=ax, label="hourly")
dfs_5h_mean.plot(ax=ax, label="5h resampled mean")
dfs['wind_ma_5h'].plot(ax=ax, color='black', label="5h moving average")
ax.legend()
ax.set_xlabel("")
ax.set_ylabel("Wind speed (m/s)")
ax.grid(linestyle=":")
plt.show()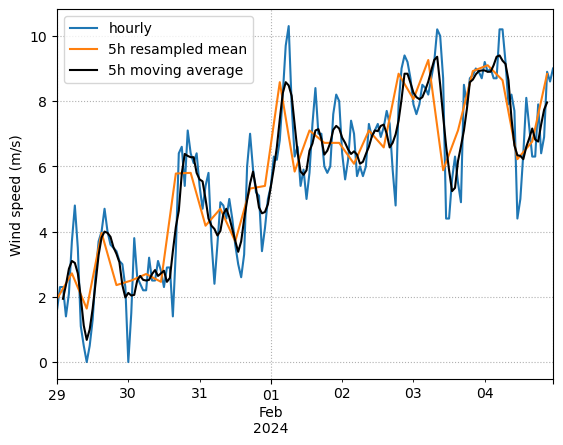
Question 3: Debug a code snippet!
The following code cell contains 1 syntax error and 3 semantic errors.
Fix them! (4.5 points)
# Code block with errors
keywords = ["Python", "programming", "exam"]
letter   = "o"

count_total = 0
count_per_keyword = 0

for word in keywords:
    for char in word:
        if char is letter:
            count_per_keyword += 1
    print(f"{word:14}: "{char}" appears {count_per_keyword} times.")
    count_total += count_per_keyword
    count_per_keyword = 0

print("")
print("In total, letter {letter} appears {count_total} times.")
Cell In[18], line 12 print(f"{word:14}: "{char}" appears {count_per_keyword} times.") ^ SyntaxError: invalid syntax. Perhaps you forgot a comma?
# Code block without errors
keywords = ["Python", "programming", "exam"]
letter   = "o"

count_total = 0
count_per_keyword = 0

for word in keywords:
    for char in word:
        if char == letter:
            count_per_keyword += 1
    print(f"{word:14}: '{letter}' appears {count_per_keyword} times.")
    count_total += count_per_keyword
    count_per_keyword = 0

print("")
print(f"In total, letter {letter} appears {count_total} times.")
Python : 'o' appears 1 times.
programming : 'o' appears 1 times.
exam : 'o' appears 0 times.
In total, letter o appears 2 times.