import math
import numpy as np
import pandas as pd
import matplotlib.pyplot as pltCorrection of 2nd exam 2023/24
NES—Programmiertechniken (Introduction to scientific programming)
12.03.2024
Please work through the following tasks. You have 75 minutes to complete the exam.
Make sure you executed all relevant code cells and save the notebook before the end of the exam.
This is a correction of the exam questions. Like always in programming, there are many ways to achieve similar results. My suggestions here follow our coding exercises discussed in class.
If you want to solve this exam as an exercise, download the uncorrected notebook.
Question 1: Multiple-choice (5 points)
To tick correct answers, replace - [ ] with - [x]
Careful: wrongly ticked answers will give negative points!
(a) Which of the following statements are true? (2.5 points)
(b) Which of the following statements are true? (2.5 points)
Question 2: datetime calculations (6 points)
- Create a DataFrame
dfwith a DatetimeIndex ranging from2024-01-01to2024-12-31in daily sampling. (1 point)
df = pd.DataFrame(index=pd.date_range('2024-01-01', '2024-12-31', freq='D'))- Create a column named
day_of_yearthat stores the day of the year from 1 to however many days there are in 2024. (1 point)
df['day_of_year'] = df.index.day_of_year
# df['day_of_year'] = np.arange(1, df.shape[0]+1) # alternative solution without `index`- Create another column
squaredthat computes the square ofday_of_year(i.e.,day_of_yearto the power of two.) (0.5 points)
df['squared'] = df['day_of_year']**2- At which date is
squaredequal to 3600? (1 point)
df.index[df['squared'] == 3600]DatetimeIndex(['2024-02-29'], dtype='datetime64[ns]', freq='D')- Resample the Series
squaredto their monthly minimum and maximum values and plot them in a quick working plot.
The code cell for this task should contain a maximum of five lines. (2.5 points)
dfr = pd.DataFrame()
dfr['max'] = df['squared'].resample('M').max()
dfr['min'] = df['squared'].resample('M').min()
dfr.plot()

## Alternative solution:
# dfr1 = df['squared'].resample('M').min()
# dfr2 = df['squared'].resample('M').max()
# fig, ax = plt.subplots()
# dfr1.plot(ax=ax)
# dfr2.plot(ax=ax)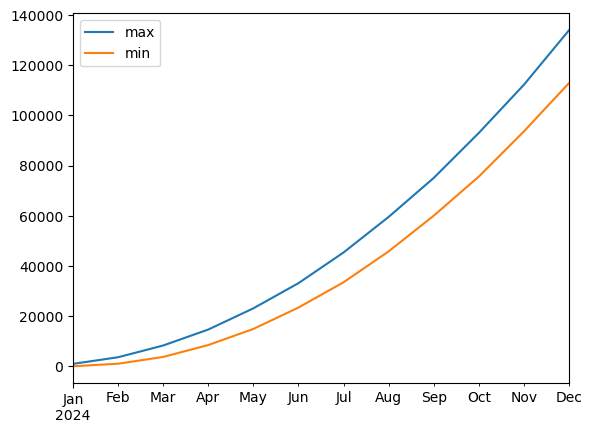
Question 3: Spreadsheet data (9 points)
Your working directory contains a spreadsheet dataset.csv.
Solve the following tasks:
- Load the data contained in the spreadsheet
dataset.csv. (1 point)
xyvc = pd.read_csv('dataset.csv', sep=';')- How many different
classes are contained in the data set and what are their names? (1 point)
cls = xyvc['class'].unique()
print(f'There are {len(cls)} unique classes named {cls}')
There are 4 unique classes named ['cold' 'very hot' 'hot' nan]- It looks like there are some NaN’s in the DataFrame. How many are there in each column? (1 point)
xyvc.isna().sum()x 0
y 0
value 0
class 3
dtype: int64- Set the
valuefor eachclassthat is NaN to120. (1 point)
xyvc.loc[xyvc['class'].isna(), 'value'] = 120- Extract the average
valueof each class and compute the standard deviation of the resulting vector.
There are several ways to achieve this. If you are unsure, implement the solution with a loop. (2.5 points)
## Strategy 1: loop
avg_val_list = []
for cl in xyvc['class'].unique():
    avg_val_list.append(xyvc.loc[xyvc['class'].isin([cl]), 'value'].mean())

avg_val_arr = np.array(avg_val_list)
std = avg_val_arr.std()

## Strategy 2: vectorized using groupby
# avg_val = xyvc.groupby(['class']).mean()
# std = avg_val['value'].std()
# std

## Note that the result between the two solutions differ because of different implementations of the std method in numpy versus pandas.
## (They assume different degrees of freedom per default. Pass ddof=1 and they will agree.)
## The actual result does influence the points you will achieve on this task!print(std)44.914185064187755- Use the
.pivot()method to convert the DataFrame from a long format to a wide format.
xandybecome the columns and the index, while the cells should be filled with thevaluecolumn. (1 point)
wide = xyvc.pivot(columns='x', index='y', values='value')
wide| x | -5 | -4 | -3 | -2 | -1 | 0 | 1 | 2 | 3 | 4 |
|---|---|---|---|---|---|---|---|---|---|---|
| y | ||||||||||
| 10 | 0.0 | 0.000000 | 0.000000 | 0.000000 | 0.000000 | 0.000000 | 0.000000 | 0.000000 | 0.000000 | 0.000000 |
| 11 | 100.0 | 74.346826 | 63.876045 | 58.754101 | 55.876734 | 54.126183 | 53.039461 | 120.000000 | 52.103272 | 52.103272 |
| 12 | 100.0 | 83.517533 | 72.415588 | 65.281601 | 60.649651 | 57.615778 | 55.661765 | 120.000000 | 53.943350 | 53.943350 |
| 13 | 100.0 | 87.319512 | 77.010354 | 69.340846 | 63.867714 | 60.076707 | 57.557361 | 120.000000 | 55.298757 | 55.298757 |
| 14 | 100.0 | 88.766049 | 78.996704 | 71.249228 | 65.461889 | 61.334948 | 58.544683 | 56.829710 | 56.015313 | 56.015313 |
| 15 | 100.0 | 88.766049 | 78.996704 | 71.249228 | 65.461889 | 61.334948 | 58.544683 | 56.829710 | 56.015313 | 56.015313 |
| 16 | 100.0 | 87.319512 | 77.010354 | 69.340846 | 63.867714 | 60.076707 | 57.557361 | 56.023649 | 55.298757 | 55.298757 |
| 17 | 100.0 | 83.517533 | 72.415588 | 65.281601 | 60.649651 | 57.615778 | 55.661765 | 54.491880 | 53.943350 | 53.943350 |
| 18 | 100.0 | 74.346826 | 63.876045 | 58.754101 | 55.876734 | 54.126183 | 53.039461 | 52.400447 | 52.103272 | 52.103272 |
| 19 | 0.0 | 0.000000 | 0.000000 | 0.000000 | 0.000000 | 0.000000 | 0.000000 | 0.000000 | 0.000000 | 0.000000 |
- Using the wide DataFrame, re-create the following Figure as closely as possible (incl. labels). (2.5 points)
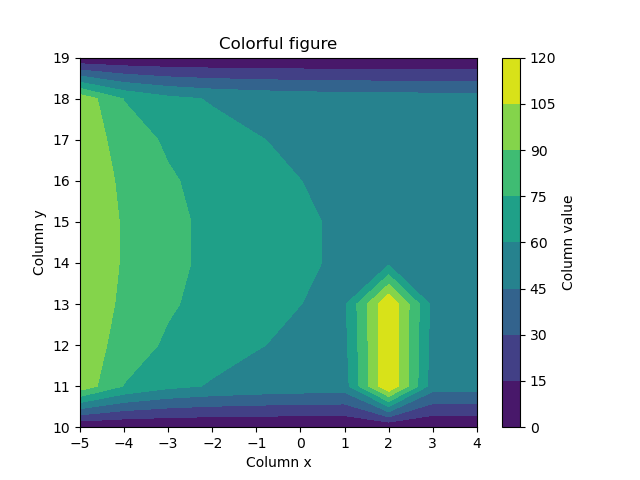
fig, ax = plt.subplots()
ct = plt.contourf(wide.columns, wide.index, wide)
cbar = plt.colorbar(ct)
ax.set_ylabel('Column y')
ax.set_xlabel('Column x')
cbar.set_label('Column value')
ax.set_title("Colorful figure")
plt.show()
Question 4: Code snippets! (7 points)
(a) Loop with user input:
The following code block misses some code. Fill in the gaps where indicated by the comments. (2 points)
numbers = []
counter = 0
maxiter = 10
while counter < maxiter:
    counter = counter + 1
    inp = input('Enter a number or finish with [q]: ')
    if inp == 'q':
        break
    try:
        numbers.append(float(inp))
    except:
        print('Invalid input')

print(f'\nProvided numbers: {numbers}')
Enter a number or finish with [q]: 1
Enter a number or finish with [q]: 2
Enter a number or finish with [q]: 3
Enter a number or finish with [q]: Text
Invalid input
Enter a number or finish with [q]: q
Provided numbers: [1.0, 2.0, 3.0](b) Mutation with side effect:
The following code cell first defines two variables x and y. Then, it prints the sum of y, mutates an element in x, and prints the sum of y again. The two print statements differ.
Make an adjustment to line 2, so that y is not affected by changes in x any more. (2 points)
x = np.arange(10)
y = np.flip(x.copy())  # changes only allowed in this line!

print(y.sum())
x[0] = -9
print(y.sum())
45
45(c) Functions:
Define a function called approx_sin which implements an approximation of the sine function given by the equation
\[ sin(x) = \sum_{i=0}^n (-1)^i \frac{x^{2i+1}}{(2i+1)!}\]
where \(!\) denotes the number’s factorial and can be computed with the function math.factorial().
The function should take \(x\) and \(n\) as inputs, where \(n\) should default to 5 if not provided by the user.
(3 points)
def approx_sin(x, n=5):
    result = 0
    for i in range(n+1):
        result = result + (-1)**i * x**(2*i+1) / math.factorial(2*i+1)

    return result
When you implemented your function, run the following code block to view the approximation error for different \(n\):
(This is not a task anymore, you don’t need to change the code for that!)
x = math.pi / 2
true_value = math.sin(x)
for n in [1, 3, 5, 7]:
    error = abs(approx_sin(x, n) - true_value)
    print(f'Error for x=π/2 and {n=}: {error:e}')
Error for x=π/2 and n=1: 7.516777e-02
Error for x=π/2 and n=3: 1.568986e-04
Error for x=π/2 and n=5: 5.625895e-08
Error for x=π/2 and n=7: 6.023182e-12