import numpy as np
import pandas as pd
import matplotlib.pyplot as pltExam
NES—Programmiertechniken (Introduction to scientific programming)
19.01.2023
Please work through the following tasks. You have 75 minutes to complete the exam.
Make sure you executed all relevant code cells and save the notebook before the end of the exam.
Question 1: Multiple-choice (5 points)
To tick correct answers, replace
- with
- [x]
Careful: wrongly ticked answers will give negative points!
- Which of the following statements are true?
- The python interpreter is a program that can read and execute code written in the python programming language.
- There are several python interpreters with several versions.
ipythonis one of these interpreters. - The python open-source ecosystem provides a large variety of packages, which are ready-made bundles of code that you can install and use.
- Everyone can write and distribute their own python package to be used by others.
- Using
condayou can create an integrated development environment to manage the installation of python and python packages you might need.
- Which of the following statements are true about this line of code:
conda create -n scipro2023 python=3.11 ipython jupyterlab numpy pandas scipy matplotlib
- This is not python code.
- This creates a conda environment with the name
scipro2023. - This triggers some installations. For example, python version 3.11 will be installed.
- After running this line, you can not install any other versions of python on the same laptop anymore.
numpy,pandas,scipy, andmatplotlibare python packages.
Question 2: datetime calculations (5 points)
Your working directory contains a python module named solar_exam. You know most of the module already from our lecture assignments. I just added one more function to it.
Solve the following tasks:
- Create a DataFrame
dfwith a DatetimeIndex ranging from2024-01-01 00:00to2024-01-31 23:00in hourly sampling.
# <your code goes here>- Use
dfand the functioncompute_solar_dataframe()contained insolar_examto fill your data frame with data columns.
# <your code goes here>- The resulting DataFrame likely contains some NaN. Which columns contain how many NaN’s?
# <your code goes here>- Resample the two columns
declinationandelevangleto daily sampling by computing each day’s average values.
Create a quick working plot of these average values with as few lines of code as possible. The resulting figure looks like that:
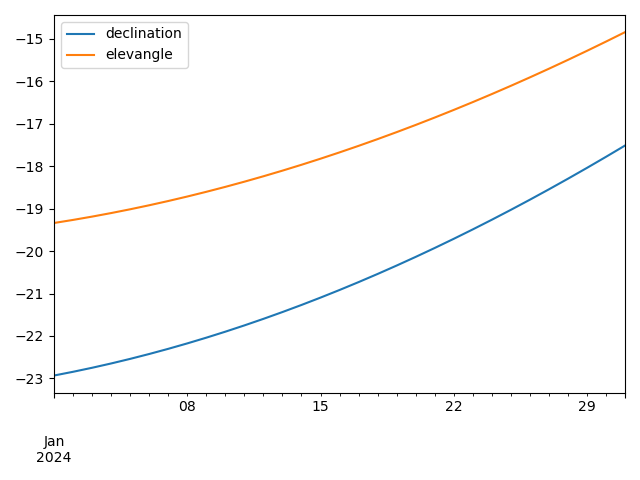
# <your code goes here>Question 3: Spreadsheet data (8.5 points)
Your working directory contains a spreadsheet data set about the hydropower consumption of different countries over several decades.
Solve the following tasks:
- Load the data contained in the spreadsheet
dataset.csvinto a DataFrame namedhc.
# <your code goes here>- How many unique countries does the data set contain?
# <your code goes here>- How many records are contained in the data set where the electricity is greater or equal to 100 but below 250 TWh?
# <your code goes here>- Sort the countries according to most hydropower consumed. Use the DataFrame methods
.groupby()and.sort_values()for this task.
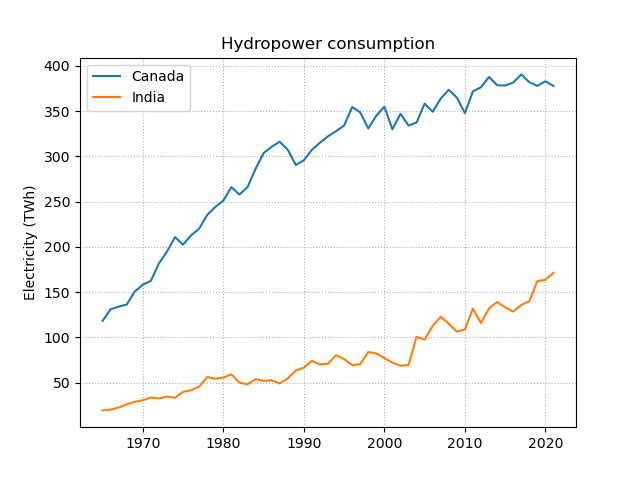
# <your code goes here>- Plot the electricity curves of the two countries with most hydropower consumption. Make your figure look as similar as possible to the following one.
If you don’t know which countries did consume most hydropower, use Canada and India.
# <your code goes here>- Not all countries are associated with a country code. Iterate through all unique countries to find out which countries are not associated with a code. Your loop should
- print a list of countries whose country code is NaN and
- count and display how many countries those are.
The DataFrame method .isin() and the numpy NaN np.nan will be helpful.
# <your code goes here>Question 4: Functions (5 points)
The following code cell contains a function signature with its documentation. Code the according function body.
Tip: You can use the numpy function np.floor() to help you separate the floating point number into its whole number and the decimal number. Consult the interactive documentation of np.floor() if you need more explanation or want to look at examples.
def pretty_print_hours(hours):
    """Convert a floating point representation of hours into a more human readable string format of 'hours:minutes'.
    The function does not allow negative inputs!

    Parameters
    ----------
    hours: float
        Hours to convert (No negative numbers allowed!)

    Returns
    -------
    out: string
        Hours in the format 'hours:minutes'

    Examples
    --------
    >>> pretty_print_hours(1.5)
    '1:30'
    >>> pretty_print_hours(-2.3)
    Traceback (most recent call last):
     ...
    ValueError: 'hours' cannot be negative!
    """
    # <your code goes here>

    return out
Check whether the output of the function is as expected:
pretty_print_hours(1.5)pretty_print_hours(-2.3)Question 5: Debugging (3 points)
Let’s first define three variables:
count = np.arange(10, 20)
v1 = np.full(count.shape, False)
v2 = np.full(count.shape, False)
Now, read through the next code block that uses logical indexing to change some values of v1:
v1[(count > 13) & (count < 17)] = TrueThe following code block tries to re-write the logical indexing into a loop.
Unfortunately, there are three mistakes in the next code block.
Fix the mistakes, so that v1 and v2 are equal.
for ct in enumerate(count):
    if ct > 13 and ct < 17:
    v2[ct] = True
Test whether v1 and v2 are equal:
np.array_equal(v1, v2)